UK: +44 (0) 8455 441 441
Ireland: +353 1 531 4450
Saudi Arabia: +966 (11) 920 007299
Organization Insights Introduction
Organization Insights Introduction
With the move from On-Prem to Online some of the easily accessible reporting and fault finding tools have fallen by the wayside. Quickly running a SQL script to bring back the biggest tables, SQL Mails for failed workflows or checking who has been creating records have been a harder to perform without 3rd Party Tools, Raising Tickets with Microsoft or Digging complicated dashboard which needed to be created for every customer. Well now with Organizational Insights we can now offer these in dashboard form with some great “Out of the box” features.
Microsoft Organization Insights is a newly released “App” that will give customers the ability to monitor their environment with more precision and statistical output with the Fall release of Dynamics 365 Online (8.2)
To install Organization Insights, you need to install the App from AppSource (link in below picture)
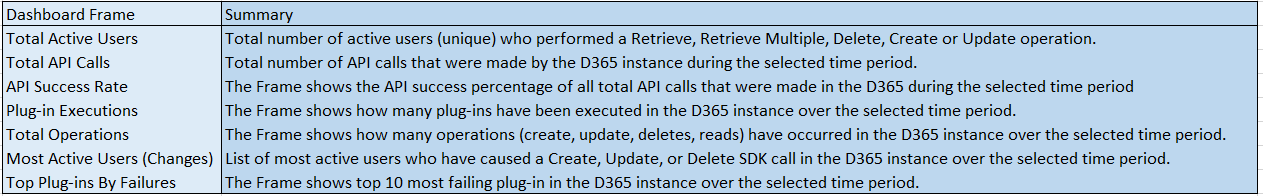
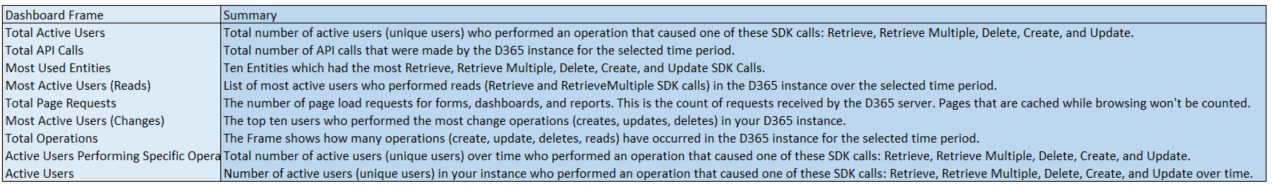
 The main KPI’s included are Performance, Storage, User Adoption & Usage. These can be monitored in several ways:
- Track the number of users in the system
- Track the number of record updates, creates and deletes.
- Track the number of entities that have been accessed.
- Recording the number of failed workflows and API calls.
- Drill down into the details of your top failing workflows and API calls.
- Expose Organization Insights entities to allow eBECS to extend the solution.
- Monitor user adoption and usage patterns.
- Update date parameters to narrow down or extend results.
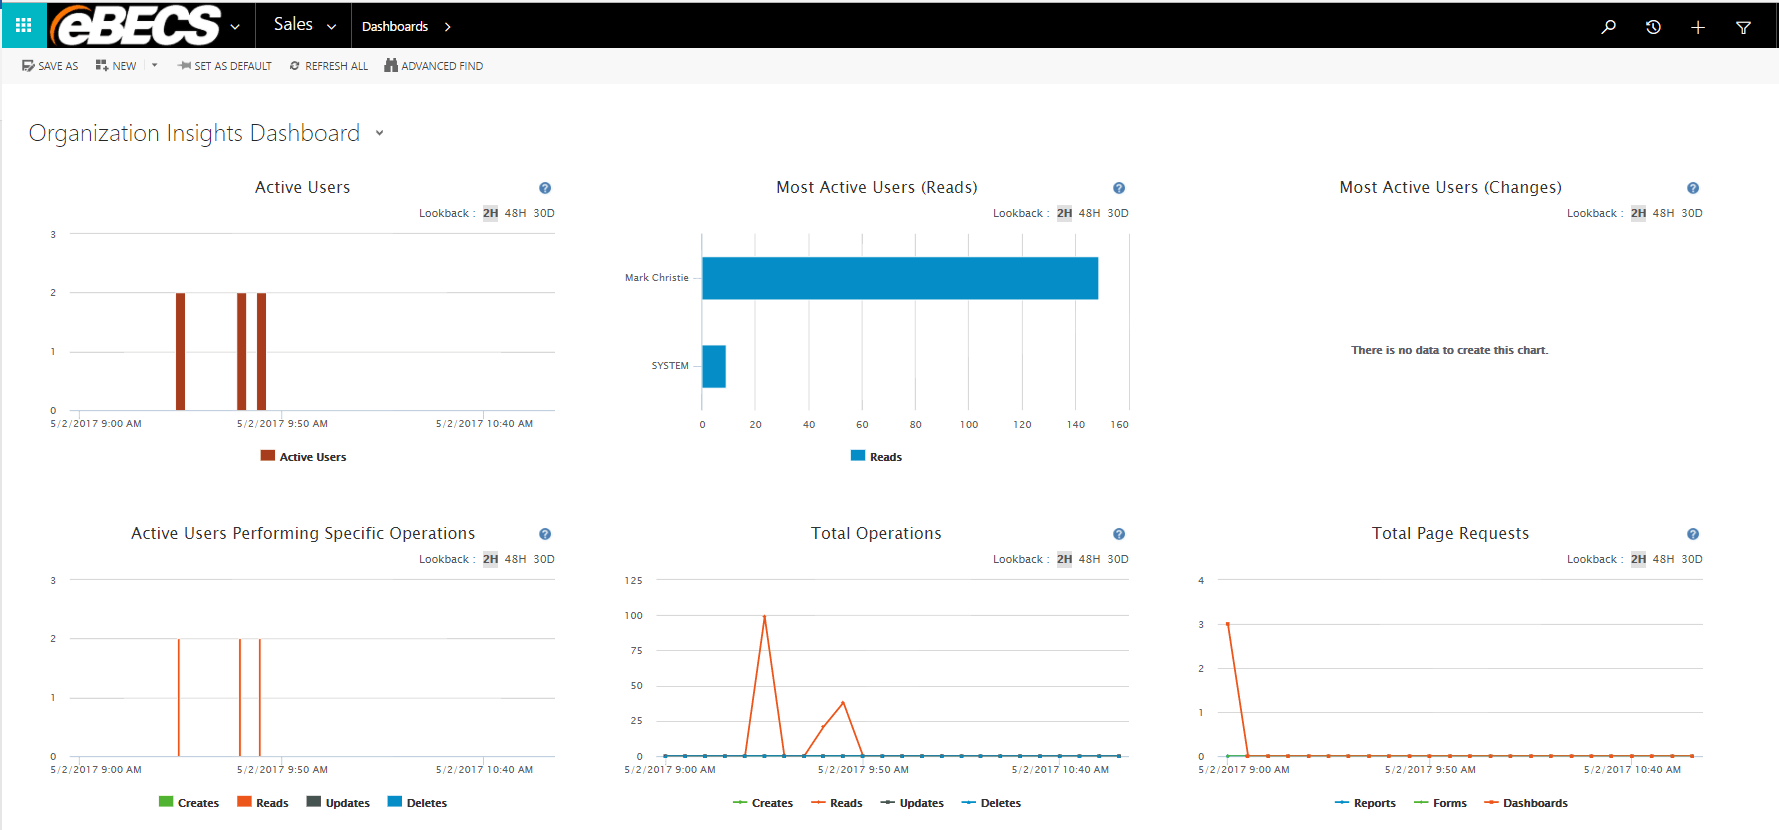
The Organization Insights has a default system dashboard called “Organization Insights Dashboard”
To gain access to the extended dashboards navigate to System>Organization Insights
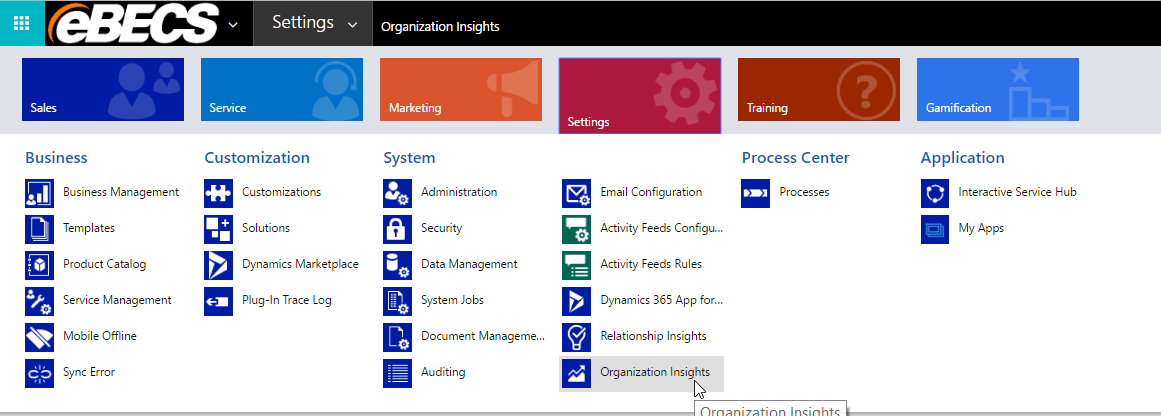
Once in Organization Insights you have access to 6 further dashboards to dig deeper into your analysis these are:
- Home
- Active Usage
- System Jobs
- Plug-Ins
- Storage
- API Calls
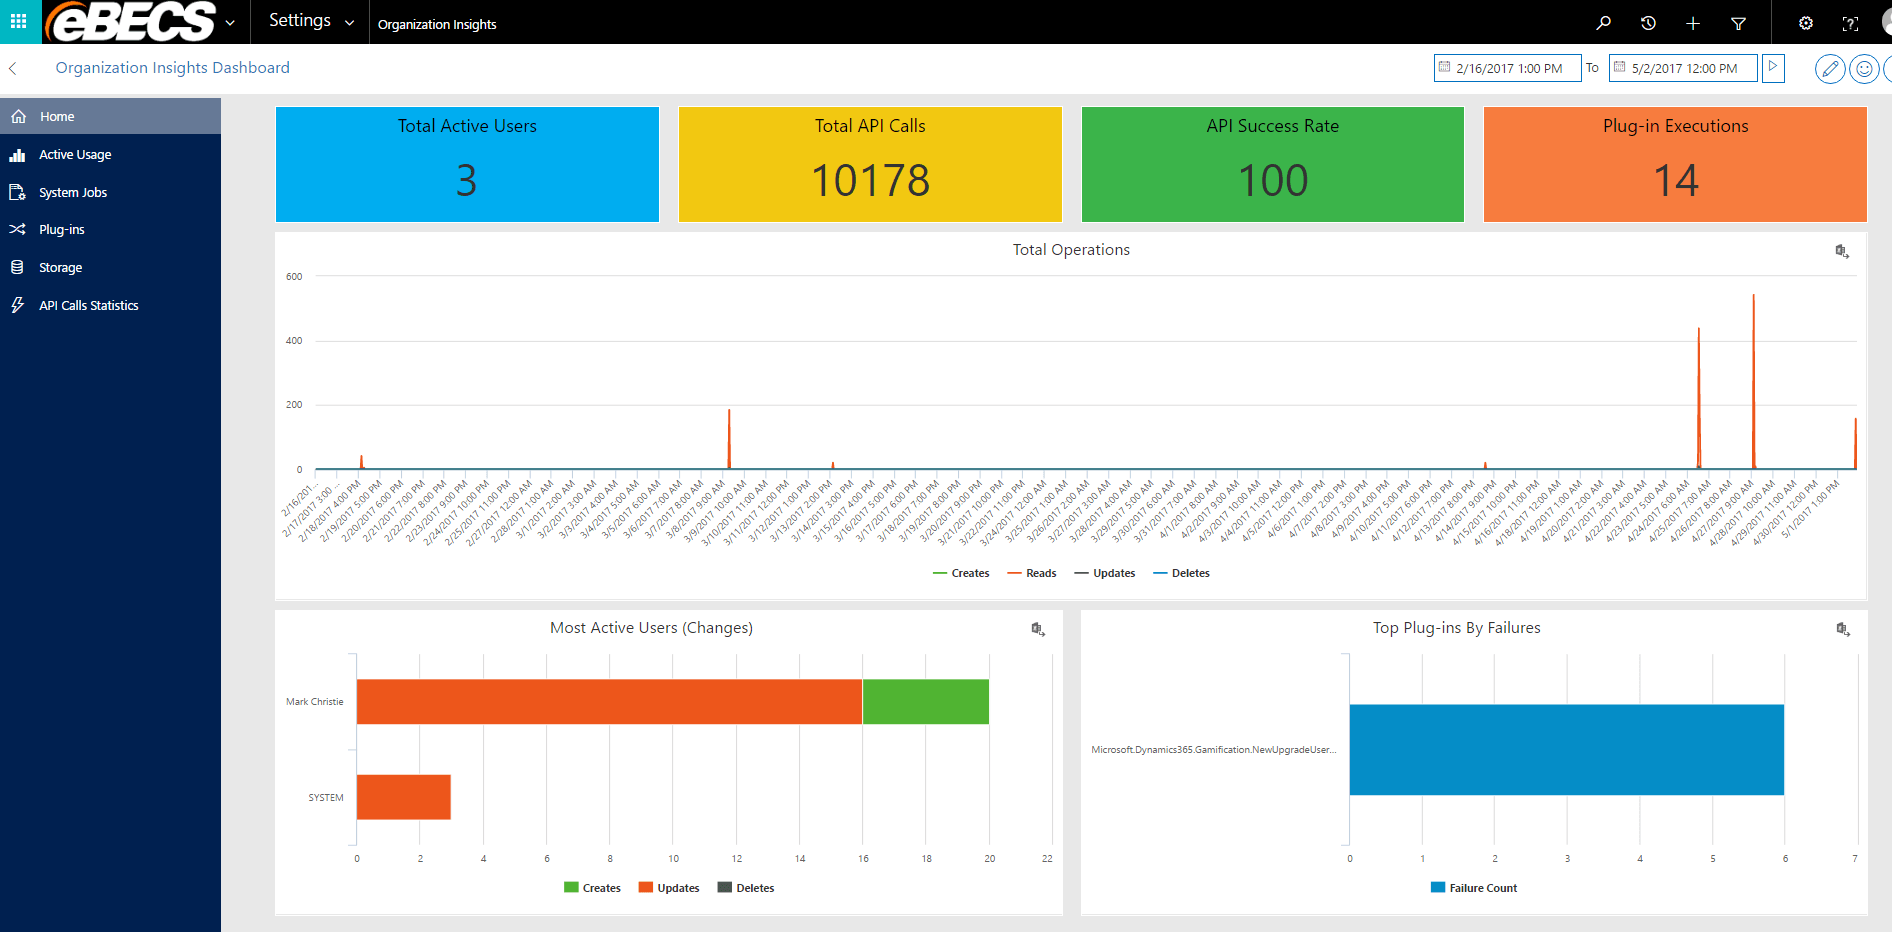
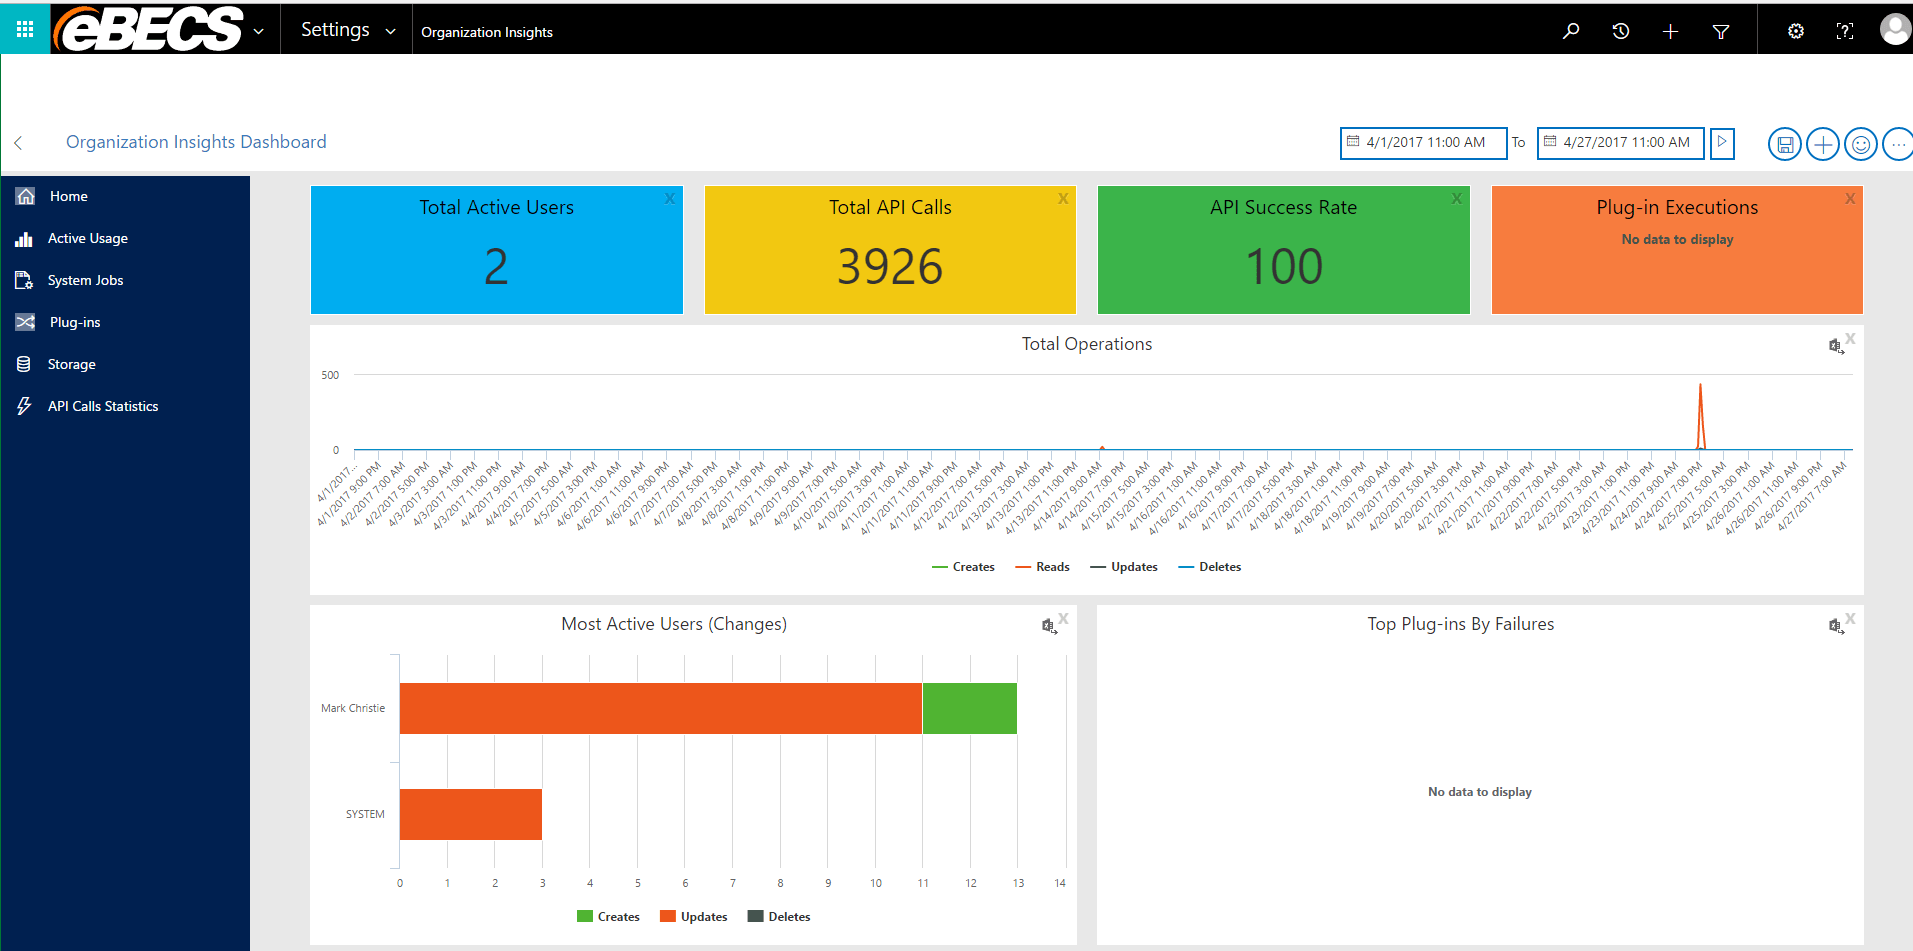
Home
This is the default dashboard that provides information on the number of active Dynamics 365 users, storage usage, the most active workflows, API’s & Plug-ins
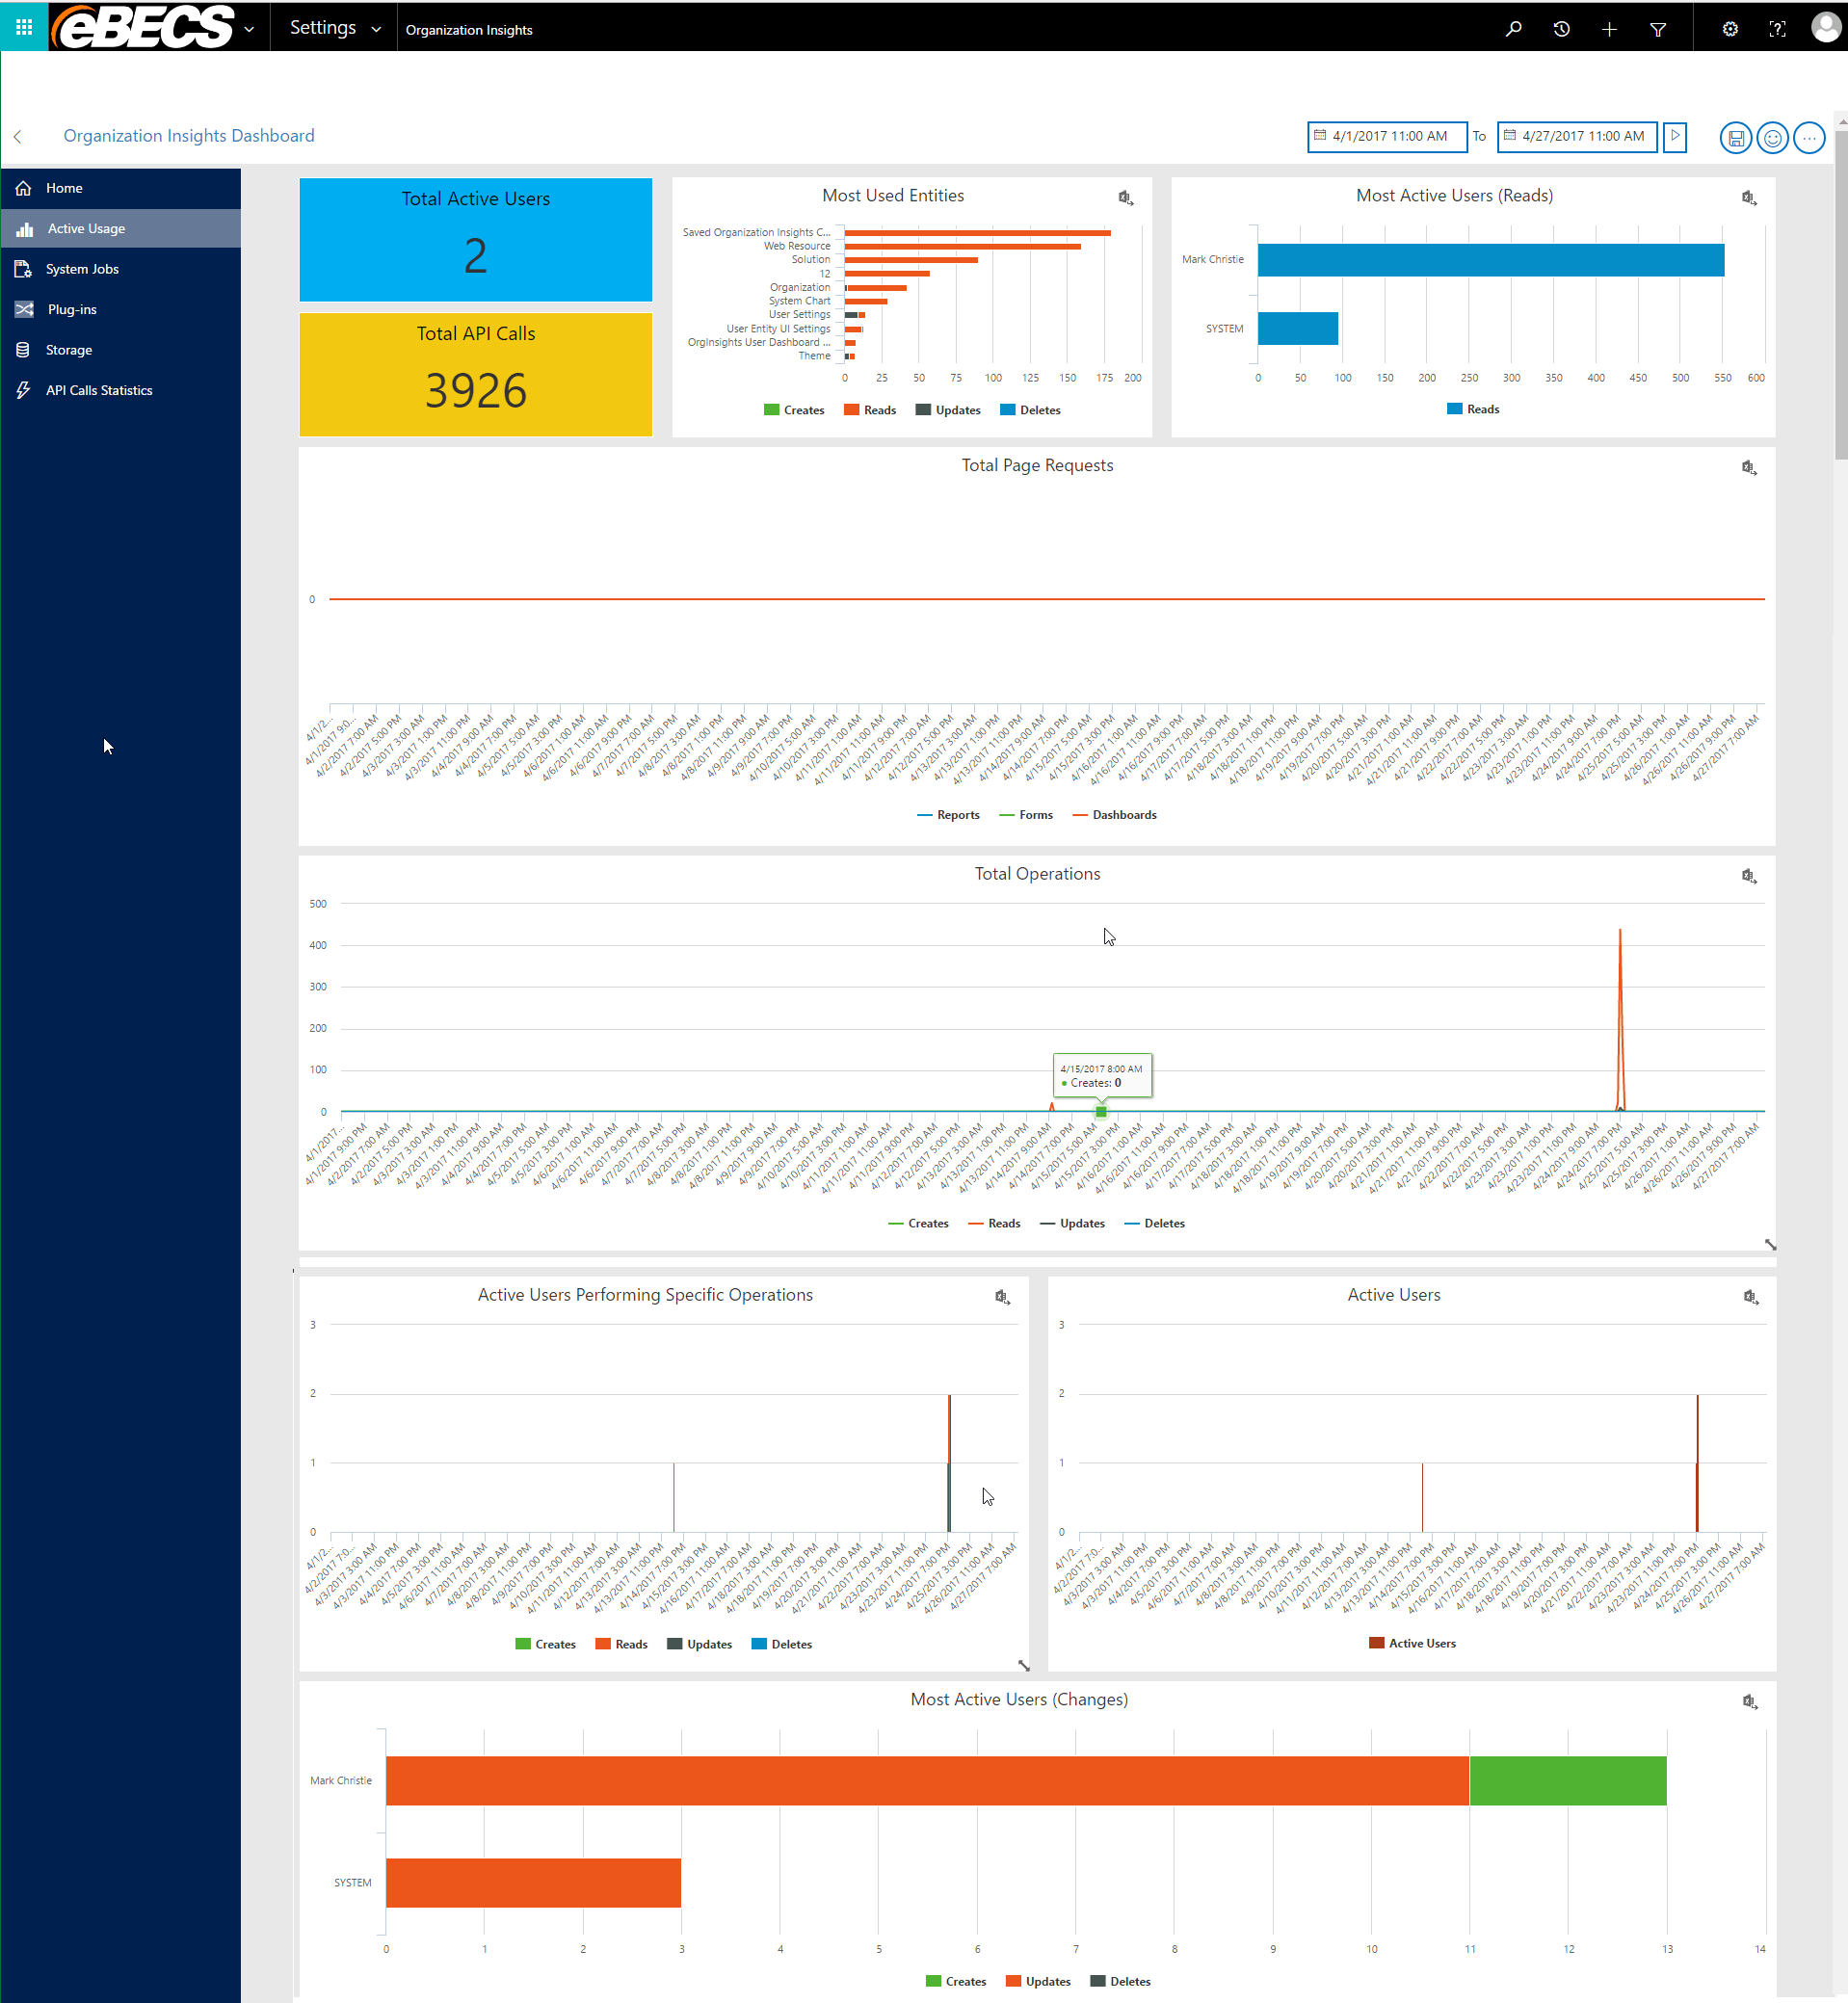
Active Usage
This dashboard can be used to find out how many D365 users there are, how many licenses are being used, the frequency of usage for custom entities and much more.
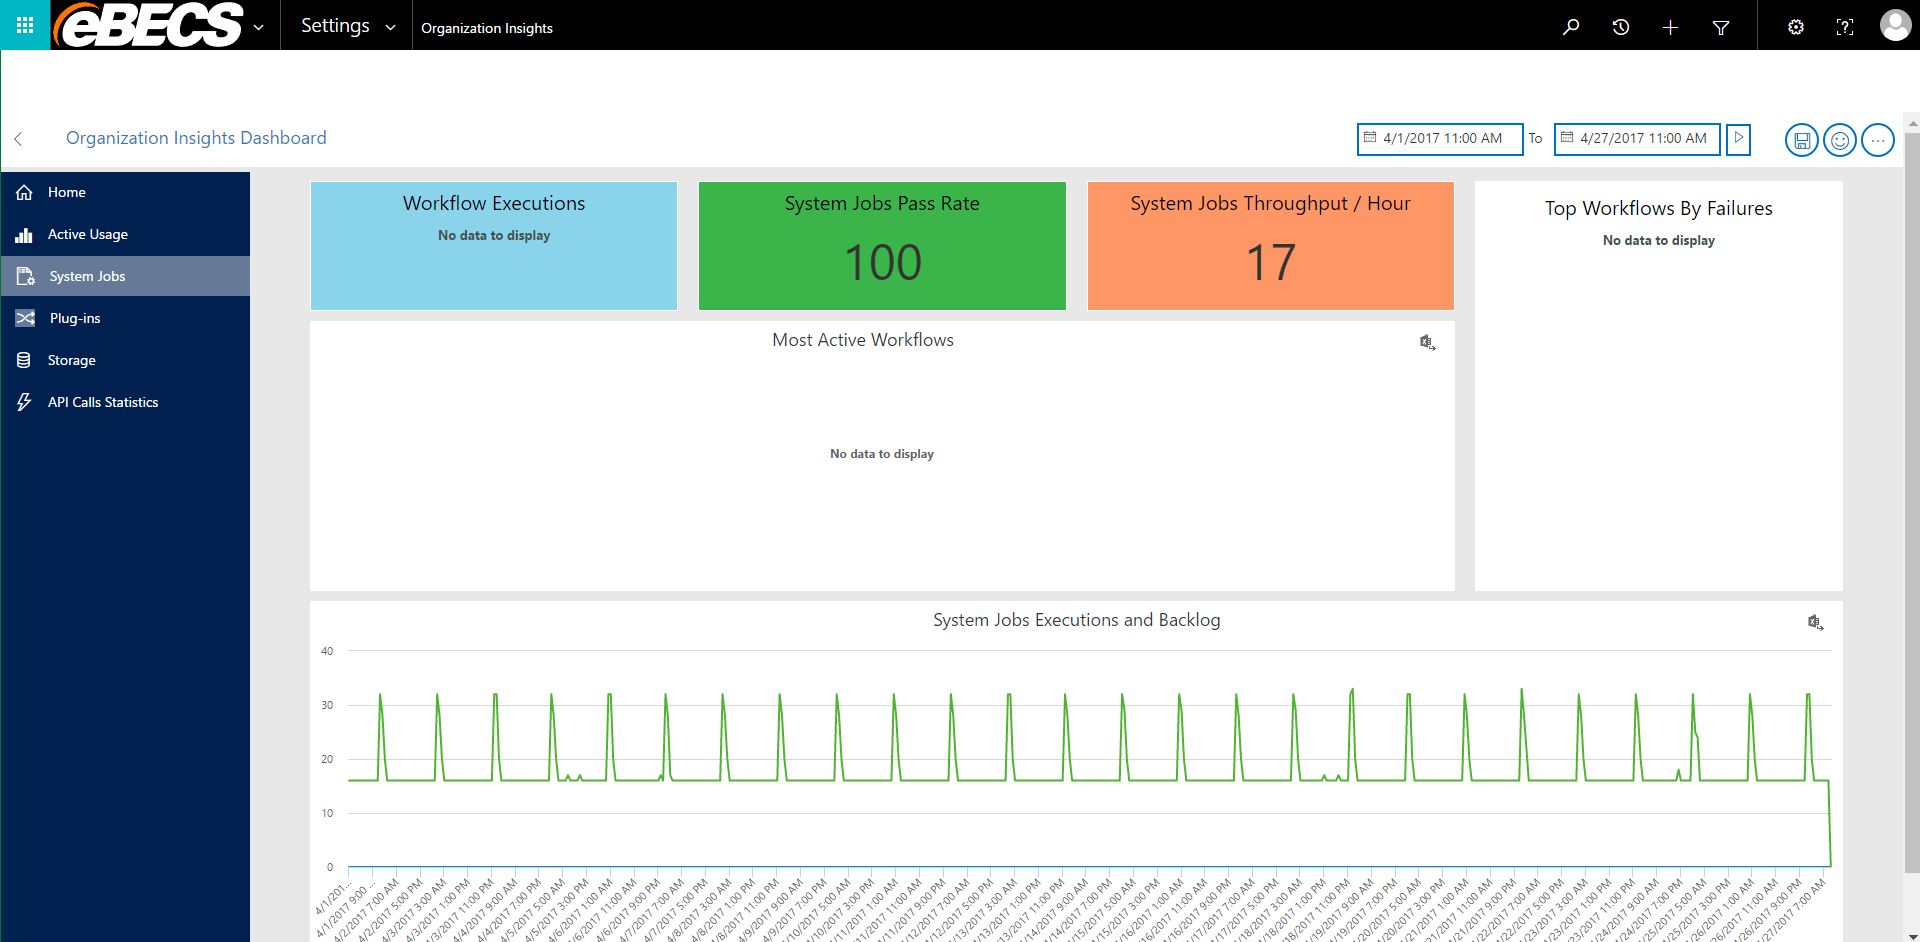
System Jobs
This dashboard can be used to manage success and failure rates of workflows, a list of the top workflows by failure and is a great place to start system troubleshooting.
Plug-ins
This dashboard can be used to monitor and troubleshoot plug-ins.

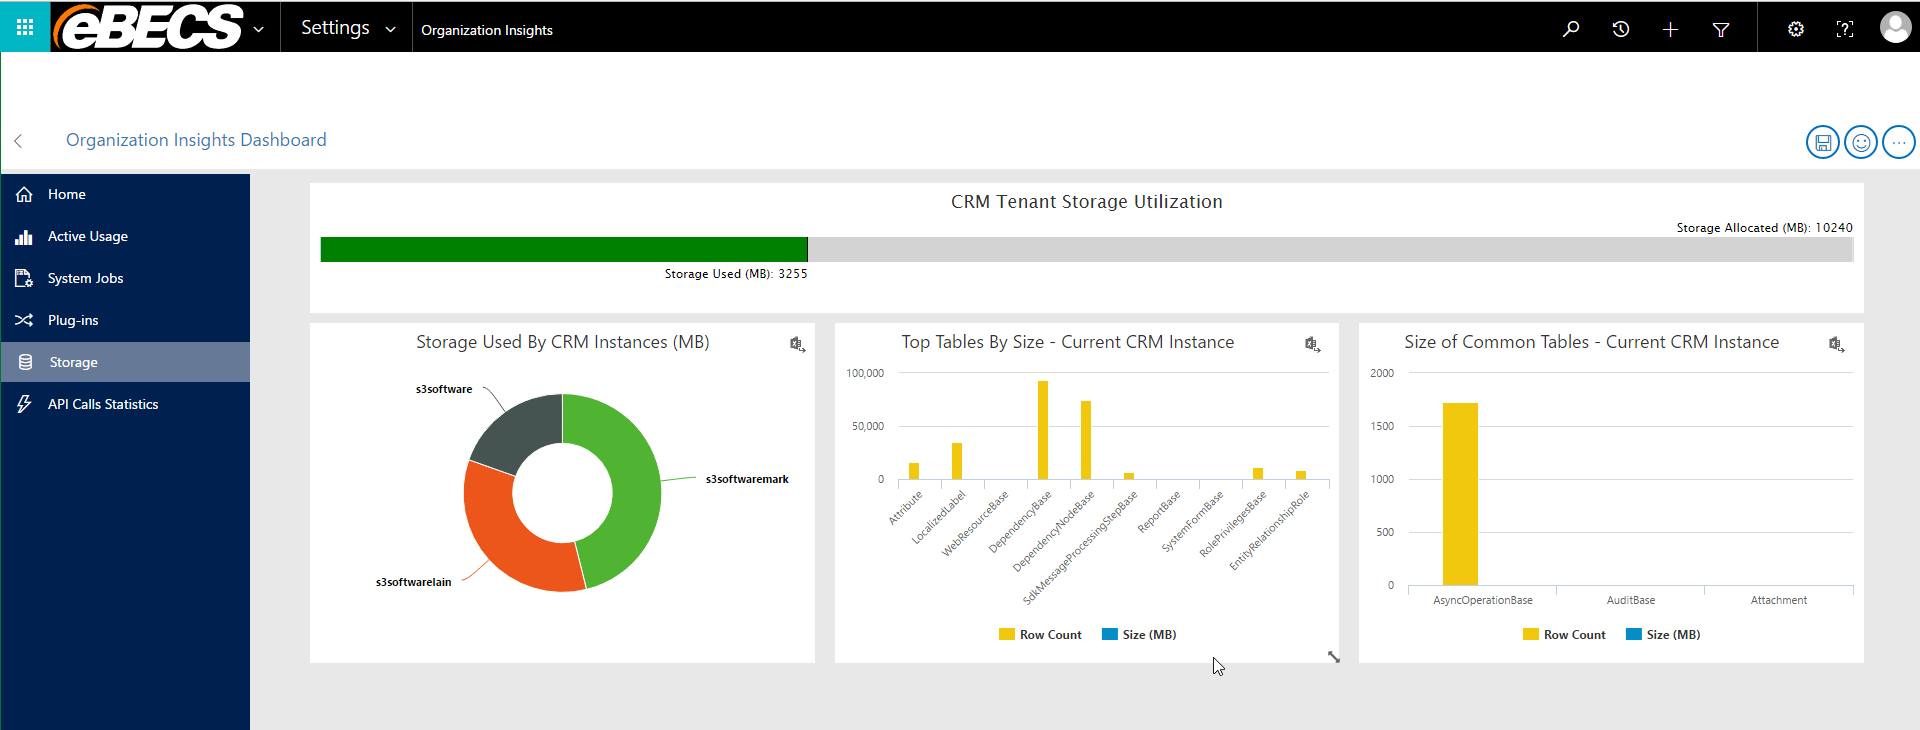
Storage
With the Storage dashboard you can glance at most used tables, size of tables and storage per instance

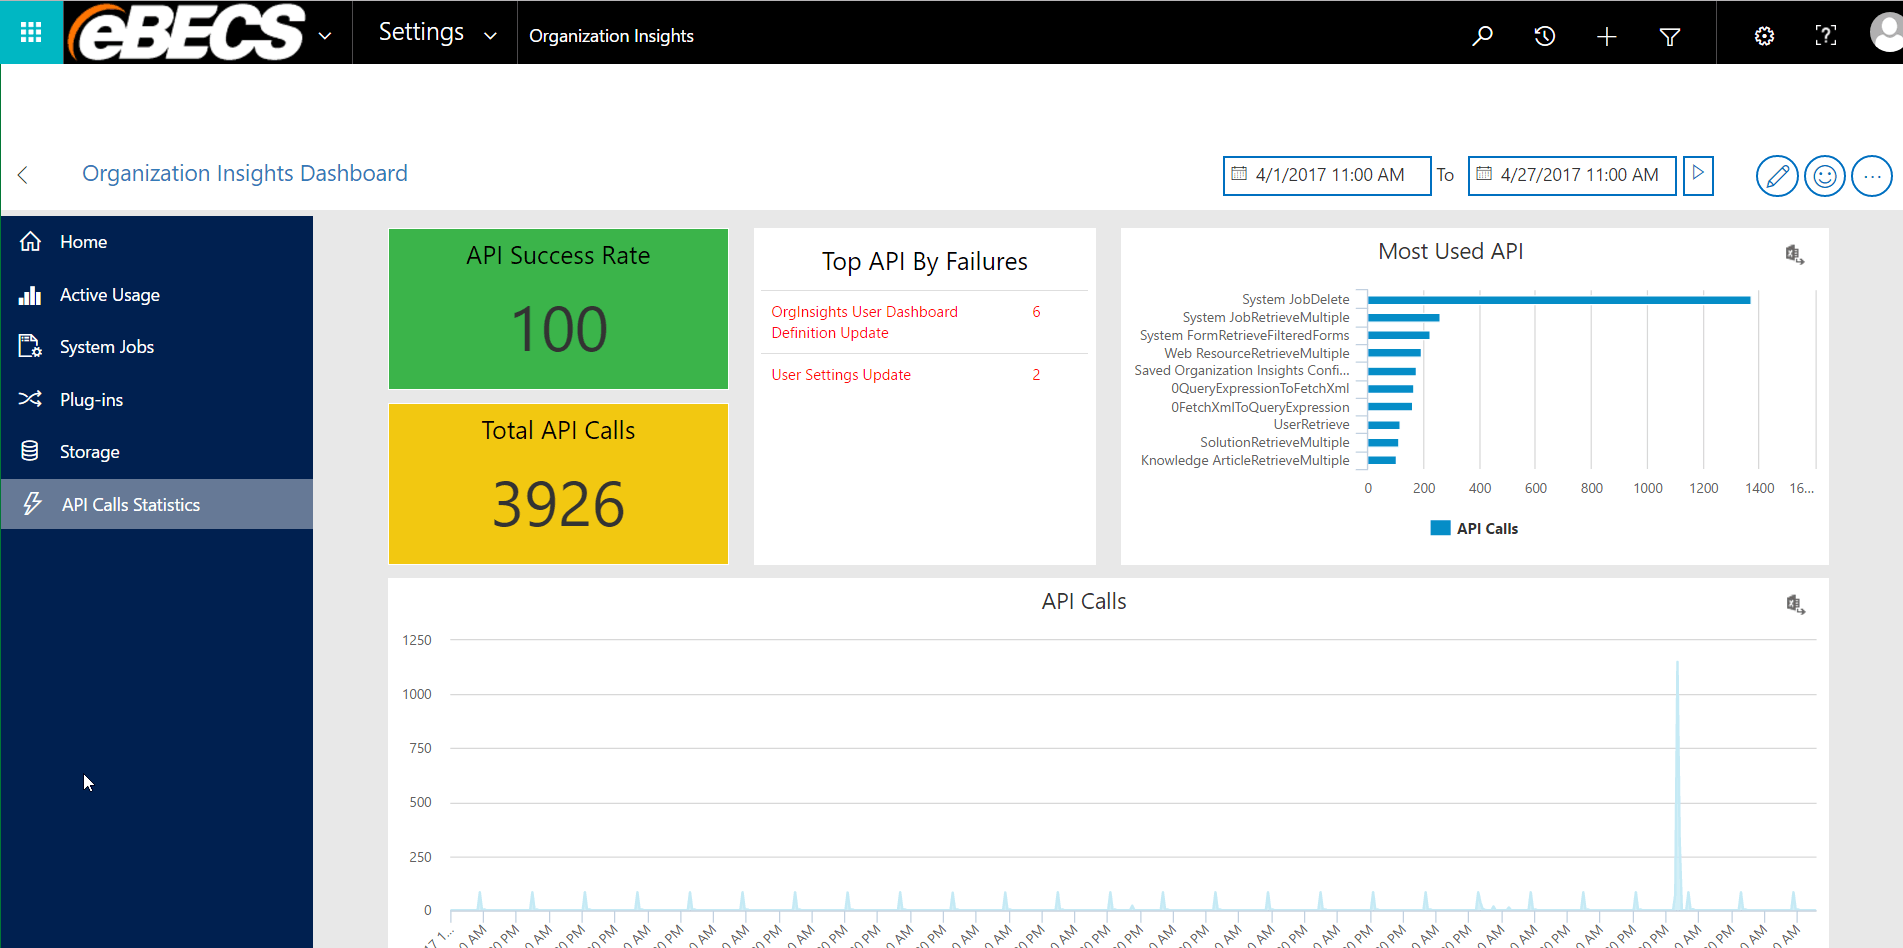
API Calls
This dashboard is used to monitor API calls and troubleshoot any failures

Date Ranges
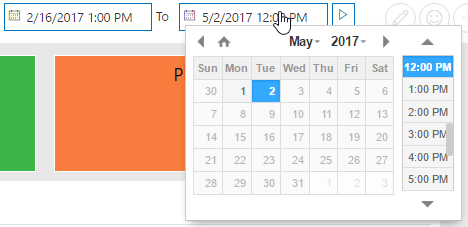
All dashboard date ranges can be changed to get more in-depth data.
To adjust the time range, select the “From” and “To” then submit
The Organization Insights calendar has the following considerations to be taken into account:
- The Calendar control is not available for the Storage dashboard and not applicable to any storage related chart as only the latest information is shown for those charts.
- Default time range is shown for the past 48 hours.
- Data is only shown for the applied time range.
- Data is available from the time of release of the solution in AppSource and will be retained for 90 days.
- Data is shown for time series at an hourly aggregation interval.
- The data shown for an hourly aggregation interval represents the whole hour. For example, if the number of active users at 2:00 PM is 5, there were 5 active users between 1:00 and 2:00 PM.
With Microsoft Dynamics 365 constantly evolving, this is a great starting point for allowing customers to do initial triage of faults, check system table usage and user activity. Previously you would have needed to log calls directly with Microsoft to gather this information so having it within a few click makes it easier for everyone. Going forward I feel that this will only expand and new items and functionality will be added – hopefully we get to the stage where we can trigger emails based on statistics from the charts.
Author Mark Christie – Check out my other blogs

Get in Touch
Email or call us now to
discuss how Microsoft
Business Solutions can
improve your business


