UK: +44 (0) 8455 441 441
Ireland: +353 1 531 4450
Saudi Arabia: +966 (11) 920 007299
Microsoft Dynamics AX Demand Forecasting: Dependent and Independent Demand
Microsoft Dynamics AX Demand Forecasting: Dependent and Independent Demand
Microsoft Dynamics AX Demand Forecasting in AX users the ability to generate forecasts at almost any level required. Sources of demand can be filtered to only include transactions of a certain type.
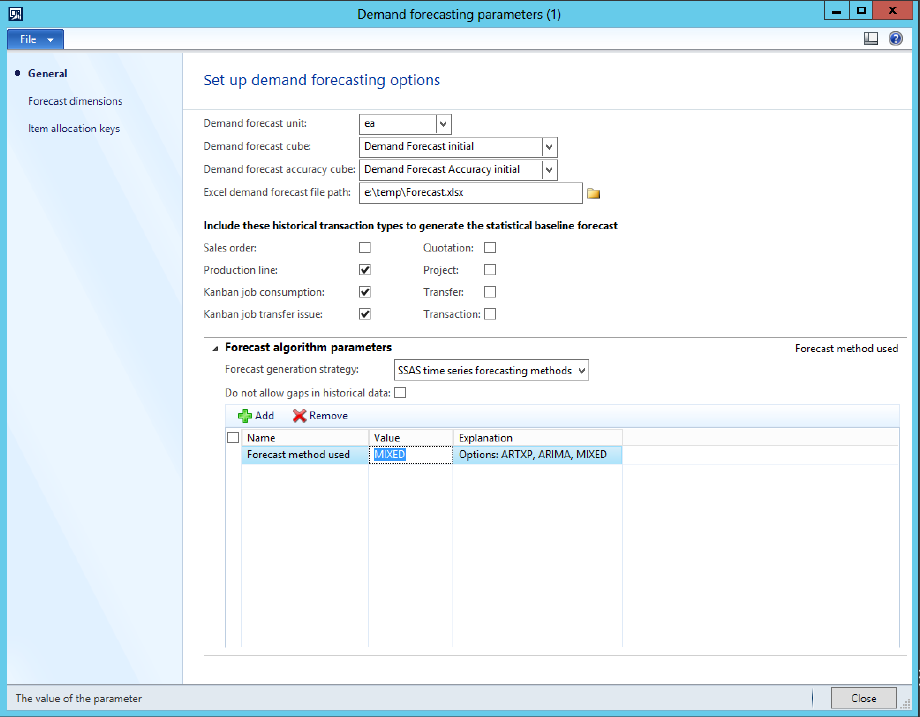
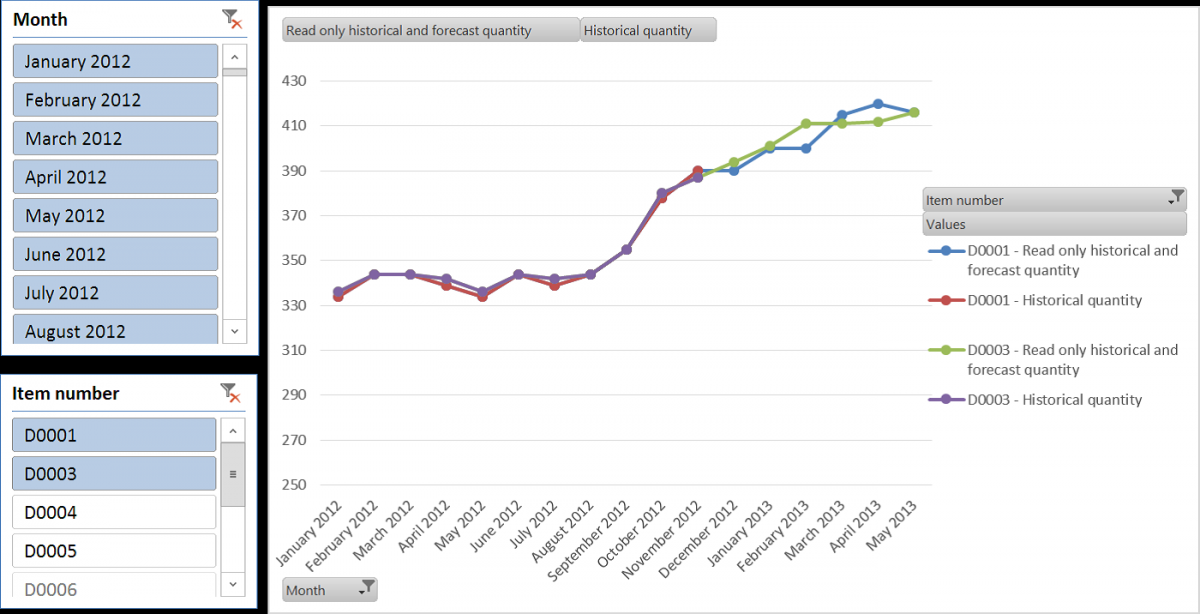
For example, to include only “Independent” demand, you could select “Sales order” as the only transaction type so that only direct customer sales orders are considered as a component of your forecast generation instead of the total use of the part against all transaction types. That is very useful if you are trying to project customer demand only, rather than forecasting your total requirements of the item over your forecast horizon. However, if only including historical data from Production lines, Kanban job consumption, and Kanban job transfer issues, like in my screenshot, you are forecasting for “Dependent” demand because the usage of the part is driven by requirements of higher level parts that consume it on production orders or kanbans. This is what would be used for forecasting purchased raw materials.
Another feature in Demand forecasting that can be utilized is a dynamics set of Forecast dimensions. By default, a demand forecast is generated at the Stock keeping (SKU) or by released product.
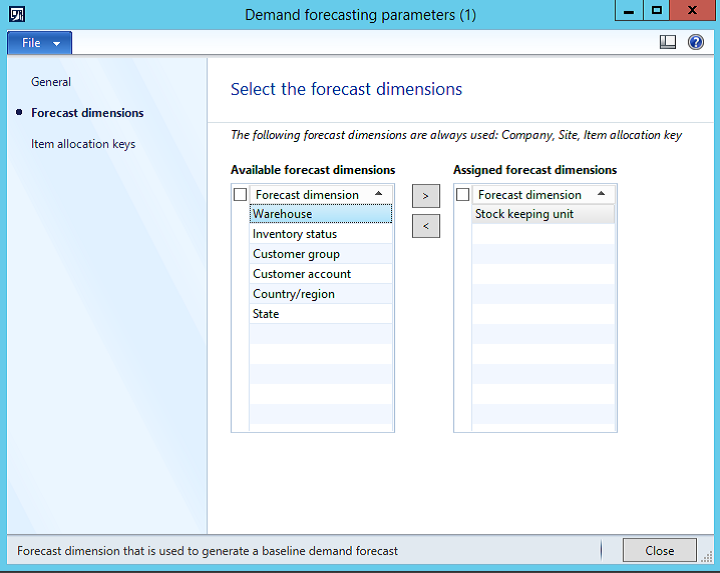
However, you can add dimensions so that you could slice and dice forecasts at the Warehouse level, inventory status, by customer group, customer account, country/region, or State. For example, you could forecast the total requirements of an item over the next year by first forecasting at the SKU level. Then you could separately generate a forecast broken down by any customer decoupling point. Below, I’m showing my forecast by customer and by item:
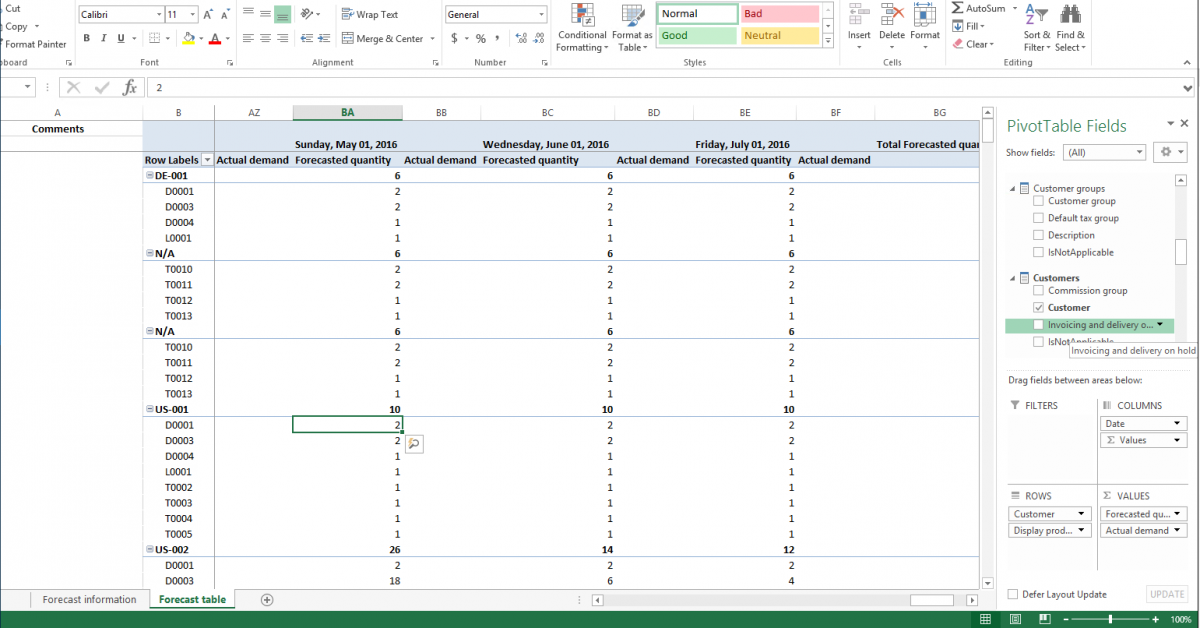
Only the Forecast dimensions set in the parameters of Microsoft Dynamics will be used when the forecast is re-imported into the system. However, if you simply want to see or run reports at a different level, you could manipulate the data in Excel to get which data you require. For example, my company may forecast by item for every customer, but if I uncheck the product number field from my PivotTable selection, then I see total demand in units for all items per customer.
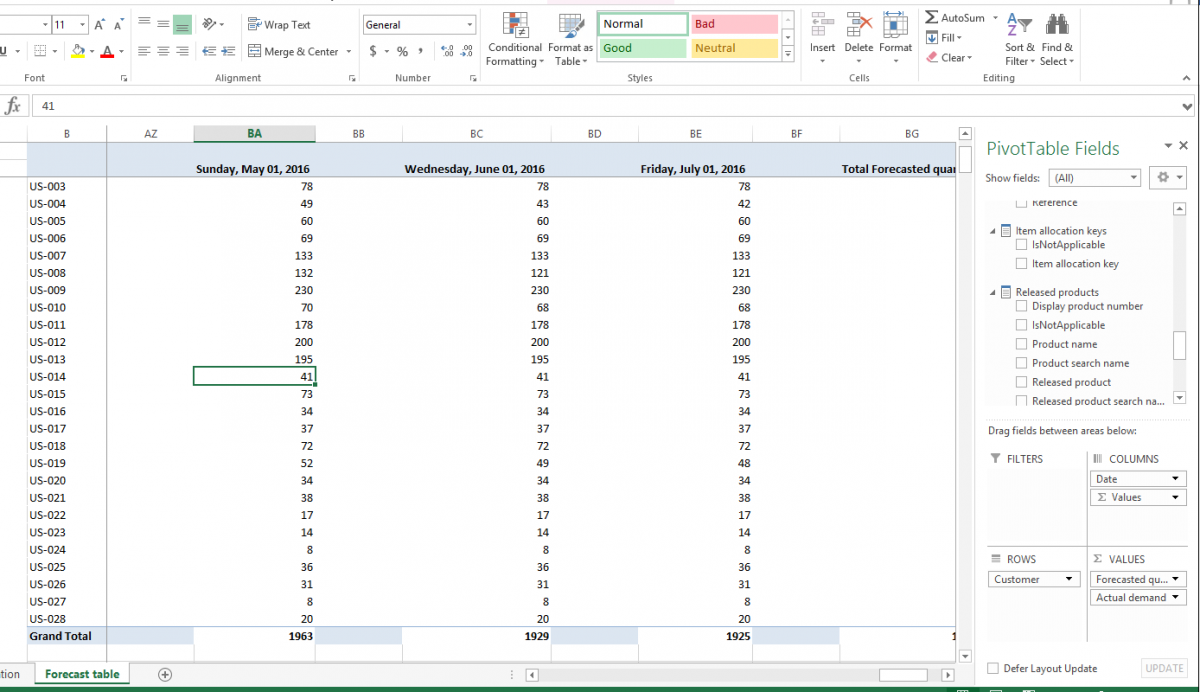
Lastly, once the forecast is generated in Excel, you can use standard pivot tables to get whatever KPI reports you want.

Get in Touch
Email or call us now to
discuss how Microsoft
Business Solutions can
improve your business


